


Simple Payback Time For 6.5 kW Of Rooftop Solar By Australian Capital — June 2019

https://www.solarquotes.com.au/blog/solar-power-payback-2019/
One year and one month ago I wrote about the simple payback time of rooftop solar, which is how long it takes the savings from solar power to equal the cost of a system. In most Australian capitals it took around 5 years or less, which meant rooftop PV was one of the best investments households could make.
I have done the same thing again — except differently — and looked at the simple payback time of a 30% larger 6.5 kilowatt solar system. The good news is, thanks to the falling cost of quality solar installations, payback times are now even faster. They’re under 6 years in every capital and under 5 in most.
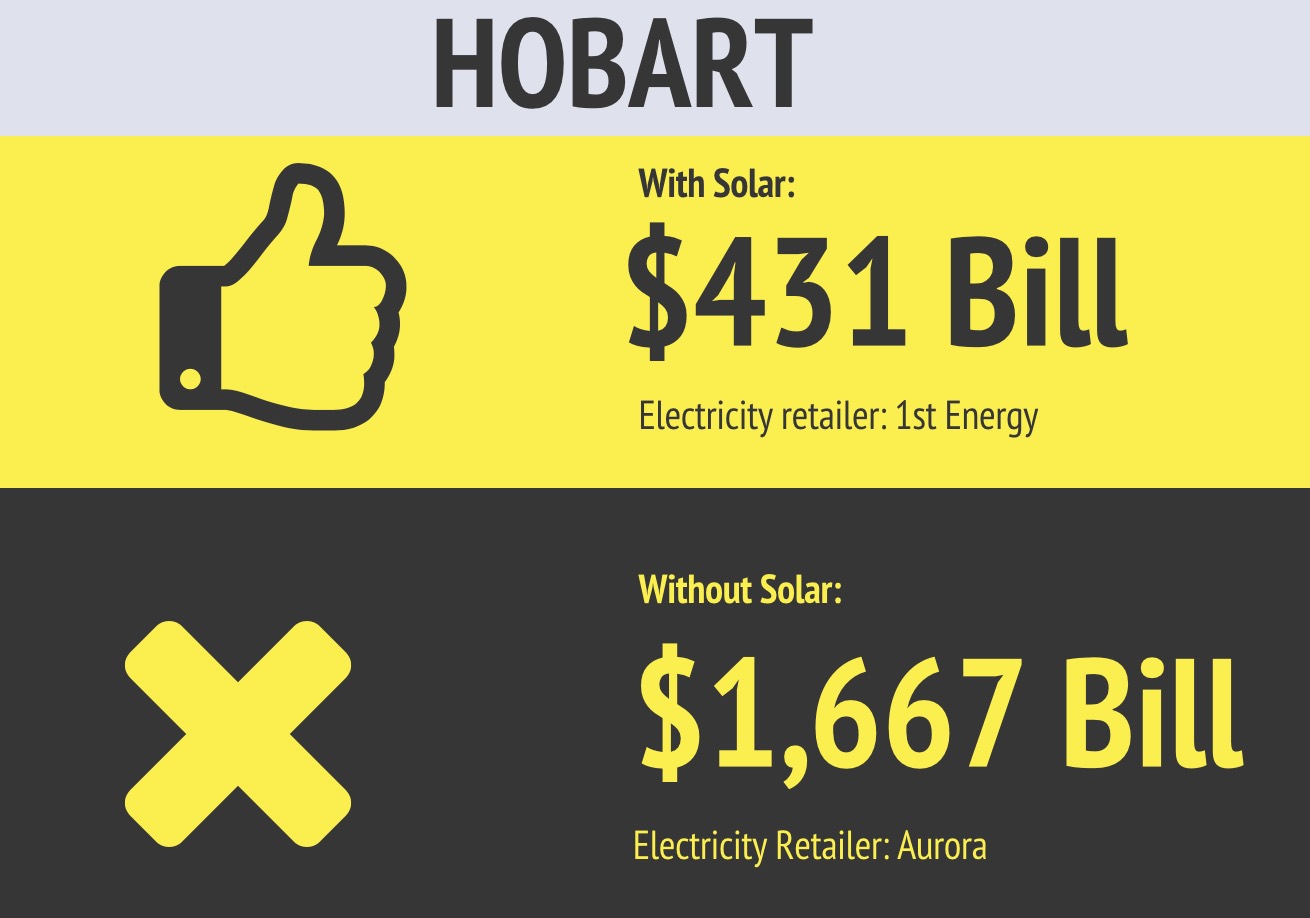
Update 1:57pm 13 June: I originally overlooked that Tasmanians can now get a 13.5 cent feed-in tariff from 1st Energy. I have updated the article to include it.
Simple Payback Is A Simple Measurement
Simple payback is just how long it takes for savings on electricity bills to equal the cost of having a solar power system installed. It doesn’t take into account the cost of:
- Capital
- Maintenance, or…
- Inspections
But this isn’t a big deal because its shortcomings aren’t bad enough to detract from its big advantage of being very simple to understand. Also, its drawbacks aren’t a major problem because:
- Short payback periods help keep capital costs low.
- Warranties means owners shouldn’t be out pocket for repairs within at least the first 5 years.
- A system inspection once every 5 years is adequate.
So when the simple payback period is around 5 years or less it should be very close to the result a more comprehensive examination of payback time would give.
Assumptions Make The Model
To determine simple payback times I’ve needed to make assumptions about:
- The size of the solar power system
- Its cost.
- Household electricity consumption.
- Solar energy system annual output.
- Self consumption of solar electricity.
- Electricity prices and solar feed-in tariffs.
Solar Power System Size
Last year I looked at the simple payback time for a 5 kilowatt solar system, but now I’m investigating 6.5 kilowatts. The reason for going up in size is not because I’ve put on weight and I’m now trying to hide it by associating with larger solar systems.1 It’s because most homes have single phase power and the maximum capacity they can conveniently install is often 6.66 kilowatts. Because rooftop solar power is a good investment I think people who have 6.66 kilowatts as an effective limit should try to get as close to it as reasonably possible. But if you can install more without difficulty I heartily recommend going for it.
A $6,500 System
I have assumed a 6.5 kilowatt system can be installed for $6,500. This is 30% less per kilowatt than the figure I used last year. While buying a larger system can be more cost effective, the main reason I decreased the price to $1,000 a kilowatt is because I am now confident that — with a sensible amount of research — people in populated areas can find good quality installers at that price. While this won’t buy the best solar energy hardware available, it will pay for a reliable system and fair and reasonable after-sales service if required.2
The cost of solar energy isn’t uniform across the country but I will use the same price for all the capitals to let their payback times be easily compared. The highest cost capitals are Hobart and Darwin due to distance, small market size, and — in the case of Darwin — the need to batten everything down so a cyclone doesn’t pick up your solar power system and drop it in the Arafura Sea.
Victoria’s Solar Homes Rebate
Melbourne is a special case because Victoria had a rebate that reduced the cost of solar by up to $2,225 for eligible households. This will start up again on the 1st of July and the word on the street is that it will be for the same amount. I will give the simple payback time for Melbourne with and without a $2,250 rebate.3
Household Electricity Consumption Assumption
To work out the simple payback time of solar power for a typical Australian household we’ll to decide how much electricity the typical household uses. It varies from capital to capital, but I’ll use a figure of 5,000 kilowatt-hours a year for all locations. This is close to the average used by Australian households without gas.
Solar System Annual Output
For the annual output of 6.5 kilowatts of solar in each capital I used 95% of the figure the PVWatts site gave me for north facing panels:
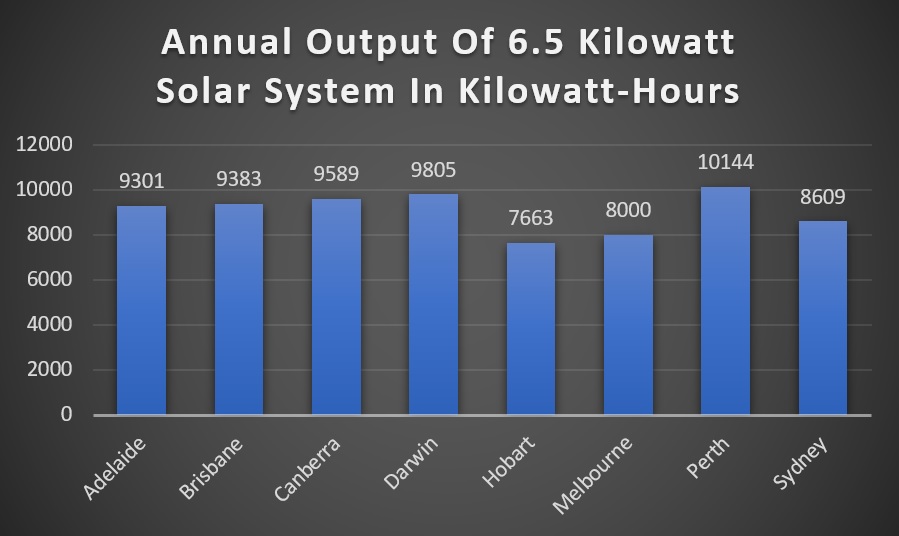
I only used 95% of the PVWatts figure because most households won’t be able to face their solar panels in the optimal direction and it allows for a minor decline in output over time.
Solar Electricity Self Consumption
Households normally consume a portion of the solar electricity they generate and send the rest into the grid for a feed-in tariff. Because the cost of grid electricity is more than the feed-in tariff, higher rates of self consumption result in faster payback times.
A smaller solar power system can result in higher self consumption and a faster payback time, but will result in smaller total savings on electricity bills. Because of this, chasing a shorter payback time by reducing a system’s size is often a false economy that can leave you wishing you installed a larger system from the start.
Households vary in self consumption, but on average those with 6.5 kilowatt solar systems self consume around 20% of the solar electricity generated, so I’ll use that figure.
Electricity Prices And Feed-In Tariffs
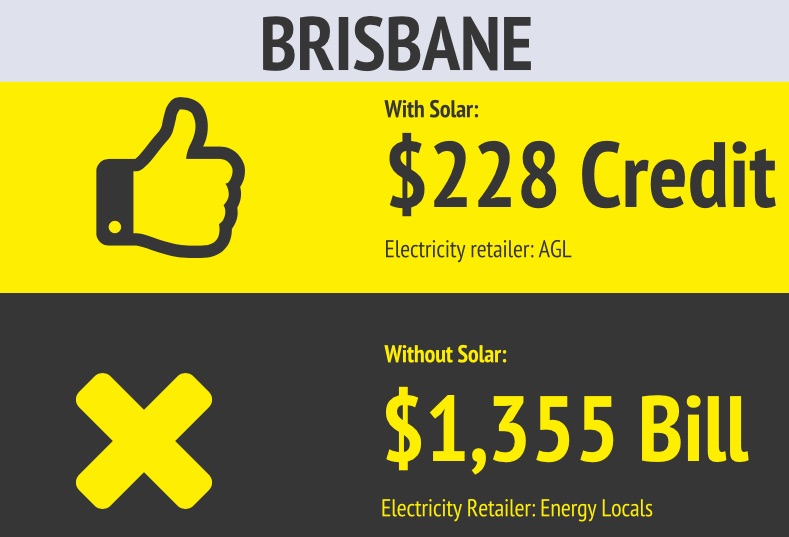
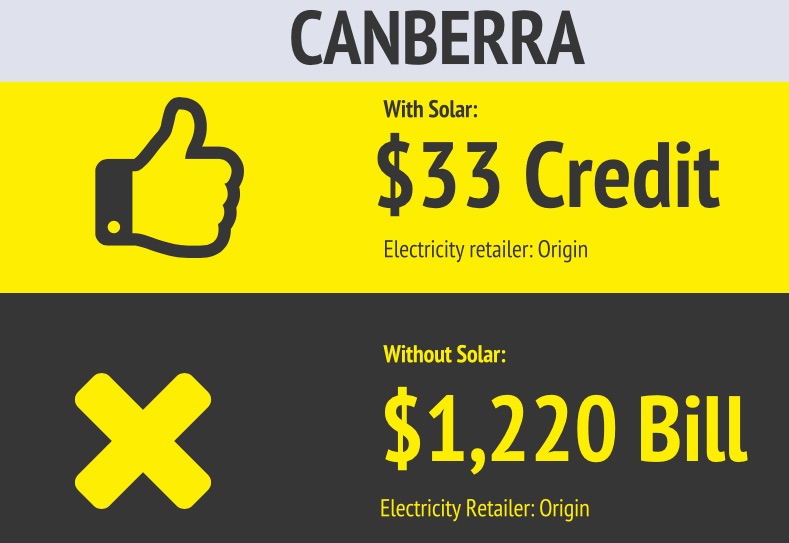
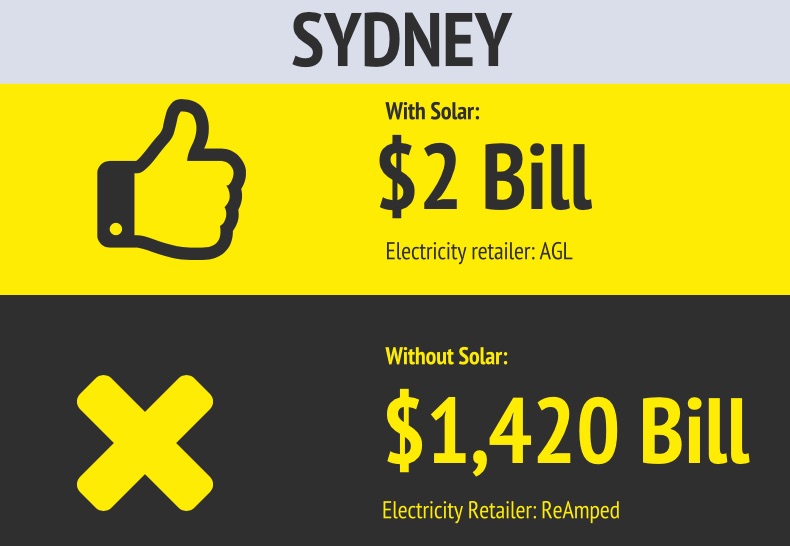
Working out how much 6.5 kilowatts of solar PV reduces annual electricity bills requires subtracting what electricity bills would be with solar panels from what they would be without panels installed. I did a search and used the most cost effective standard tariff4plans for both situations in each capital and put them in the table below along with the annual savings from installing solar panels:
Or if your eyesight is failing:
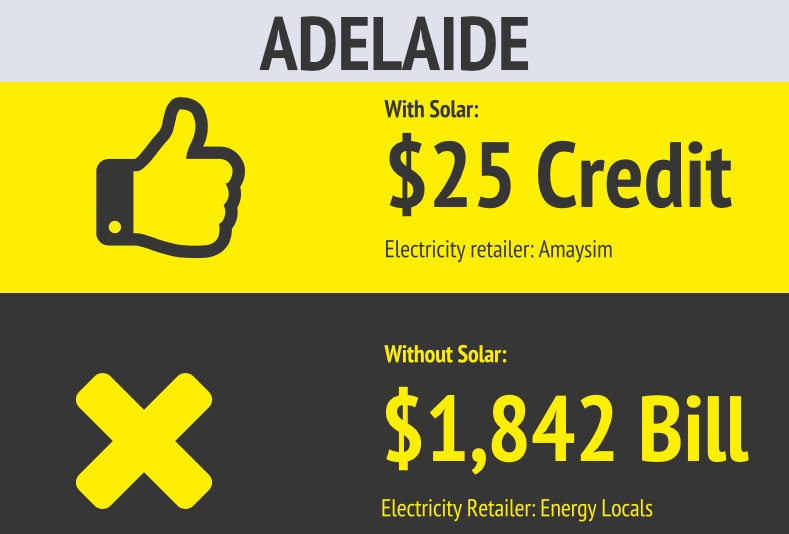
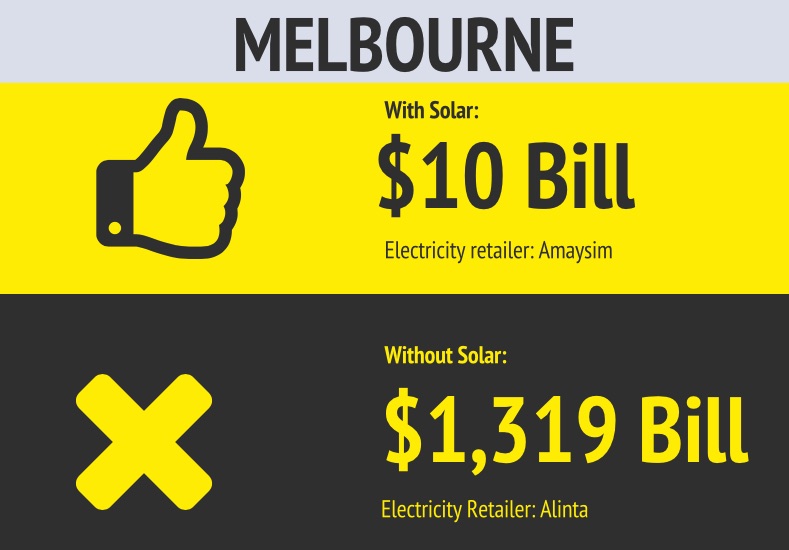
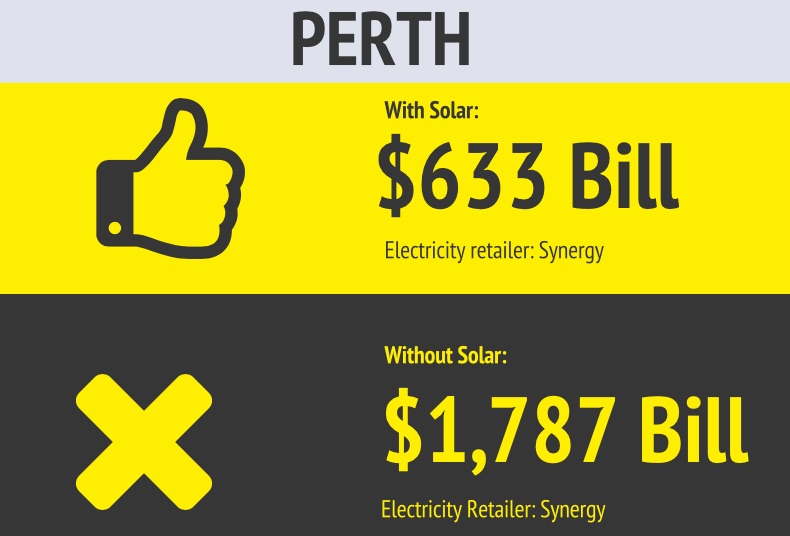
In Darwin, Hobart, and Perth electricity prices are set, but in other capitals there is retailer choice and a wide range of electricity plans to choose from. It’s possible there are better plans out there than the ones I’ve used, but they’re not likely to make a large difference. It’s also possible to bargain with electricity retailers, so you may be able to get a better deal that way, but the closer they are to being the best option available the less likely they are to budge on price.
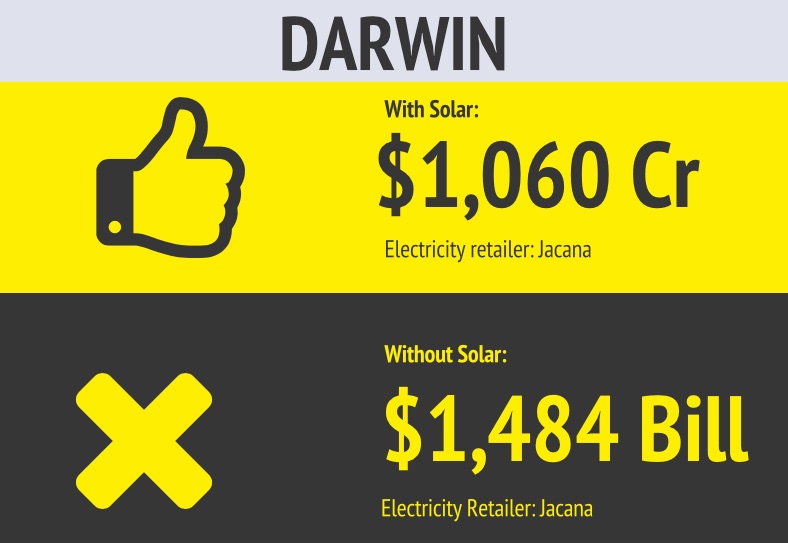
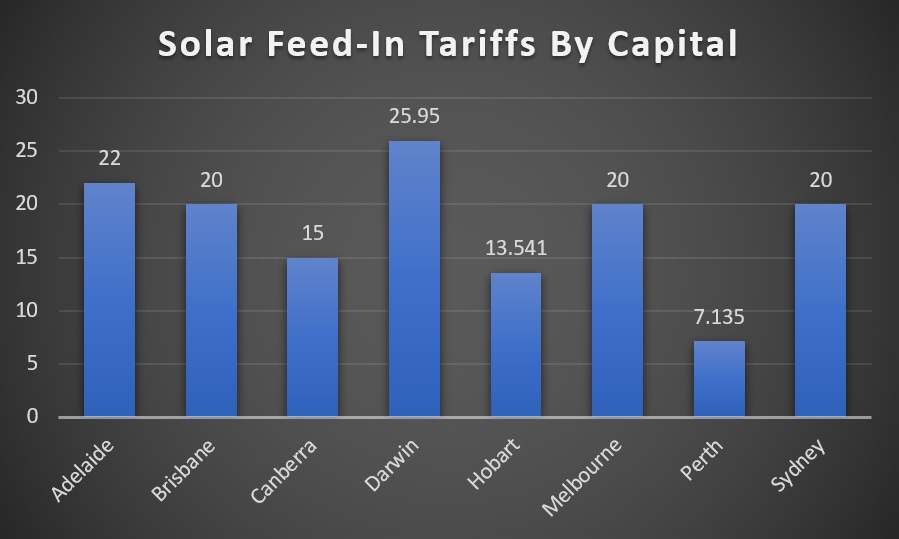
As you can see on the table above, in Adelaide, Brisbane, Canberra, and Darwin annual electricity bills with solar panels are in credit. This means over a year the household will receive more money from their electricity retailer than they pay. Darwin does especially well because their feed-in tariff is the highest in Australia and equal to the cost of grid electricity. While electricity bills in Melbourne in Sydney aren’t in credit they are close to nothing. This means in most capitals a 6.5 kilowatt solar system can reduce a typical household’s annual electricity bill close to or below zero.
This graph shows the feed-in tariff received in each capital in cents per kilowatt-hour:
Payback Times
The simple payback times for 6.5 kilowatts of solar in Australian capitals are shown in the graph below:
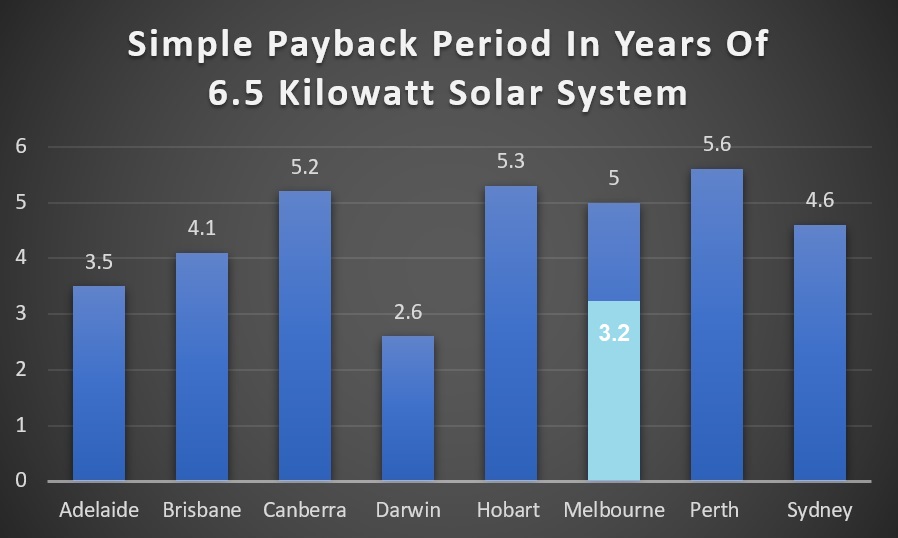
Darwin has the fastest payback time thanks to Australia’s highest solar feed-in tariff. Second fastest is in Melbourne at 3.2 years. This is indicated by the light blue section and assumes the Victorian Solar Homes Package lowers the cost of solar power by $2,225. If this isn’t included the simple payback time in Melbourne is 5 years. Adelaide comes third thanks to a high feed-in tariff and high electricity prices.
Perth has the longest payback time on the mainland5 , despite being the sunniest capital, because it has the lowest feed-in tariff. Hobart is the least sunny capital but manages to do considerably better than Perth thanks to a higher feed-in tariff being available.
Bonus Graph — Zero Solar Self Consumption!
I used a figure of 20% for solar energy self consumption. While people such as retirees who are usually at home during the day generally use more than this, some people who are normally out of the house all day may be wondering if solar energy is a good investment for them. Well, it’s no problem, I’ve got you covered and I’ve made a graph showing the simple payback time for every capital if you somehow manage to use no solar electricity at all yourself.
This should almost be impossible because even if there is no one at home for every hour of daylight every day of the week, appliances such as refrigerators and freezers should still be drawing power. But in the interest of showing a worst-case scenario, here are the results:
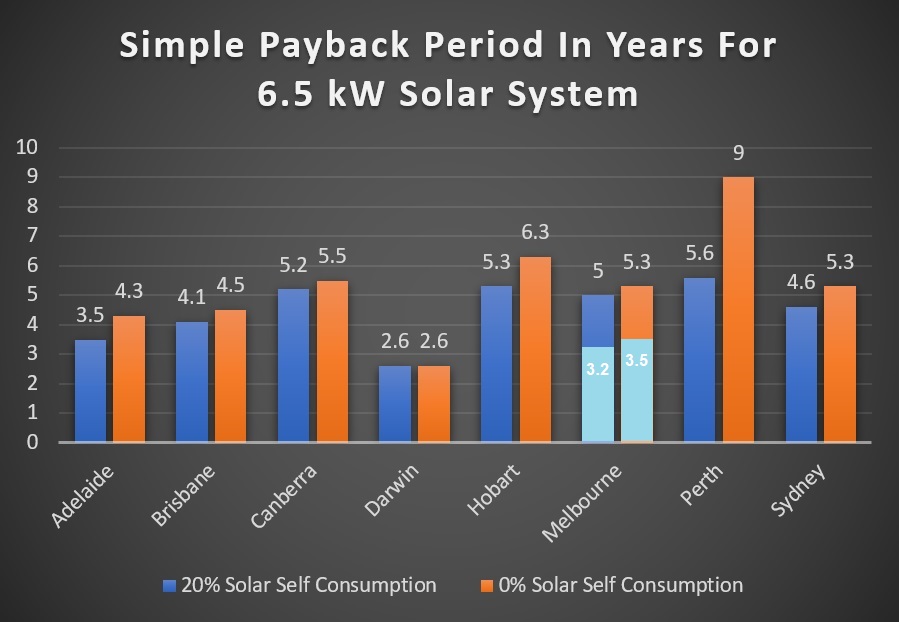
As you can see, zero self consumption doesn’t make a huge difference in most capitals and solar power still pays for itself very quickly everywhere with the exception of Perth. Because their feed-in tariff is so low having zero self consumption makes a large difference. If you want a good payback time there I recommend making sure you have a reasonable self consumption rate. But everywhere else I would definitely say solar energy is still a good deal even with zero self consumption.
Solar Power Pays
Electricity prices and feed-in tariffs may decline in the future and stretch out the simple payback time of solar systems installed today. But it’s unlikely to be enough to make rooftop solar power a bad investment.
Simple payback periods will improve further as the cost of solar drops even lower. But I’m certain you won’t save more money by waiting than you will by getting solar panels now and immediately reducing your electricity bills.
Footnotes
- That benefit is just pure luck. ↩
- I would be wary of going too far below this price point — unless you are certain the installer does good work — as very cheap solar can mean an installation where corners have been cut and little or no assistance if there’s a problem. ↩
- When this scheme starts up again it will actually be a subsidy rather than a rebate, but I may be the only person alive who cares about this. ↩
- With a standard tariff a home pays a flat rate for each kilowatt-hour of grid electricity used. I am also not considering controlled loads that can lower for cost of electricity for tasks such as heating water. ↩
- Although for some reason Perth also has the cheapest solar power system pricing in Australia so you are likely to do better than this analysis suggests ↩